Graphical evaluation of OptiSol in Design Explorer
Problem
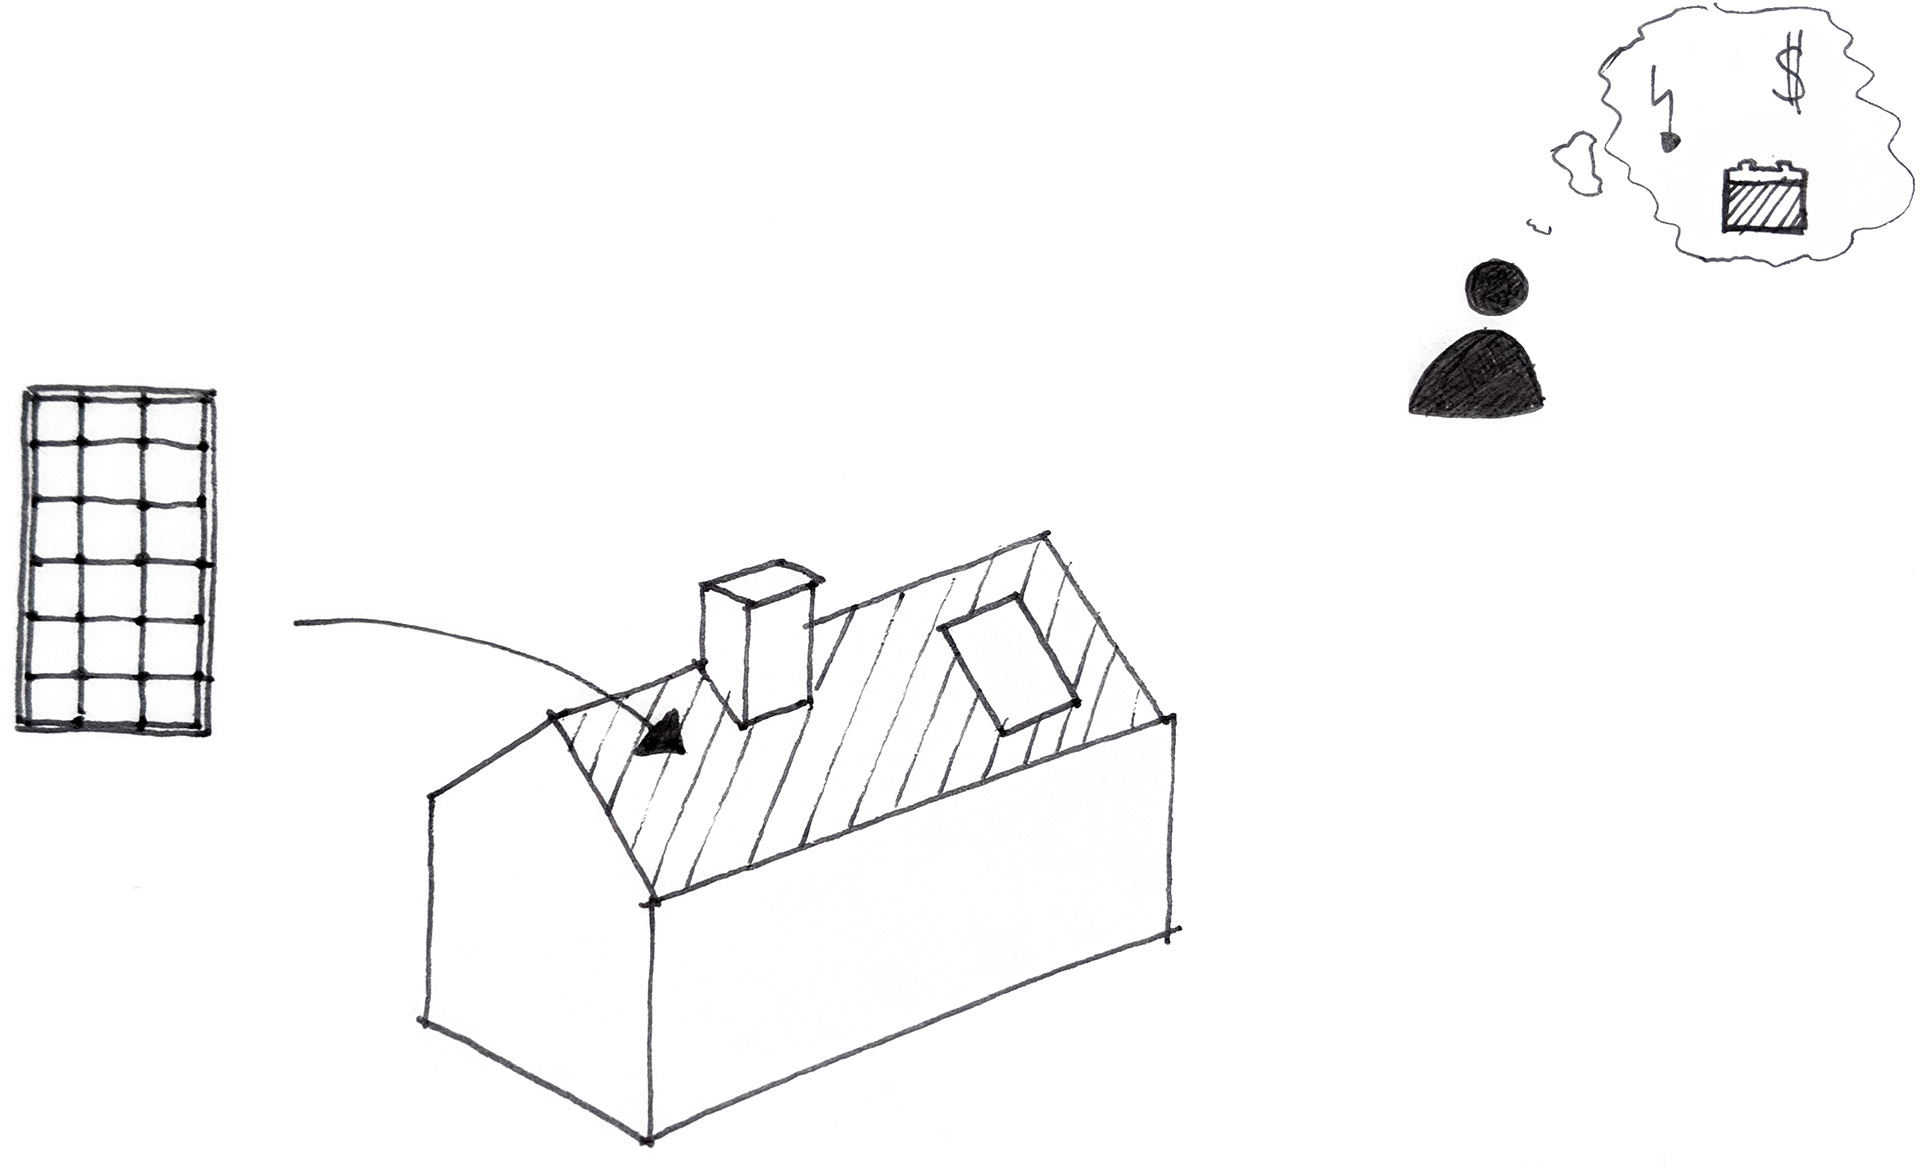
In view of the climate change and against the university background of the interdisciplinary team (energy efficient and sustainable building / architecture) the idea was born to activate unused roof areas as green energy suppliers by means of PV modules.
Based on this idea we create a tool, which is not only of interest for the knowledgeable expert, but rather enables the concerned and interested real estate owner to efficiently deal with the topic.
At the beginning the question arises "What is the potential of a roof? In order to determine this realistically, an analysis is required that takes into account many complex aspects. Starting with the location and orientation of the building, through the shading of the sometimes complex roof surface caused by surrounding objects, to the individual modules that can be used. The latter alone differ in various types of superstructure, vary in shape and size, and thus result in a wide range of costs and services.
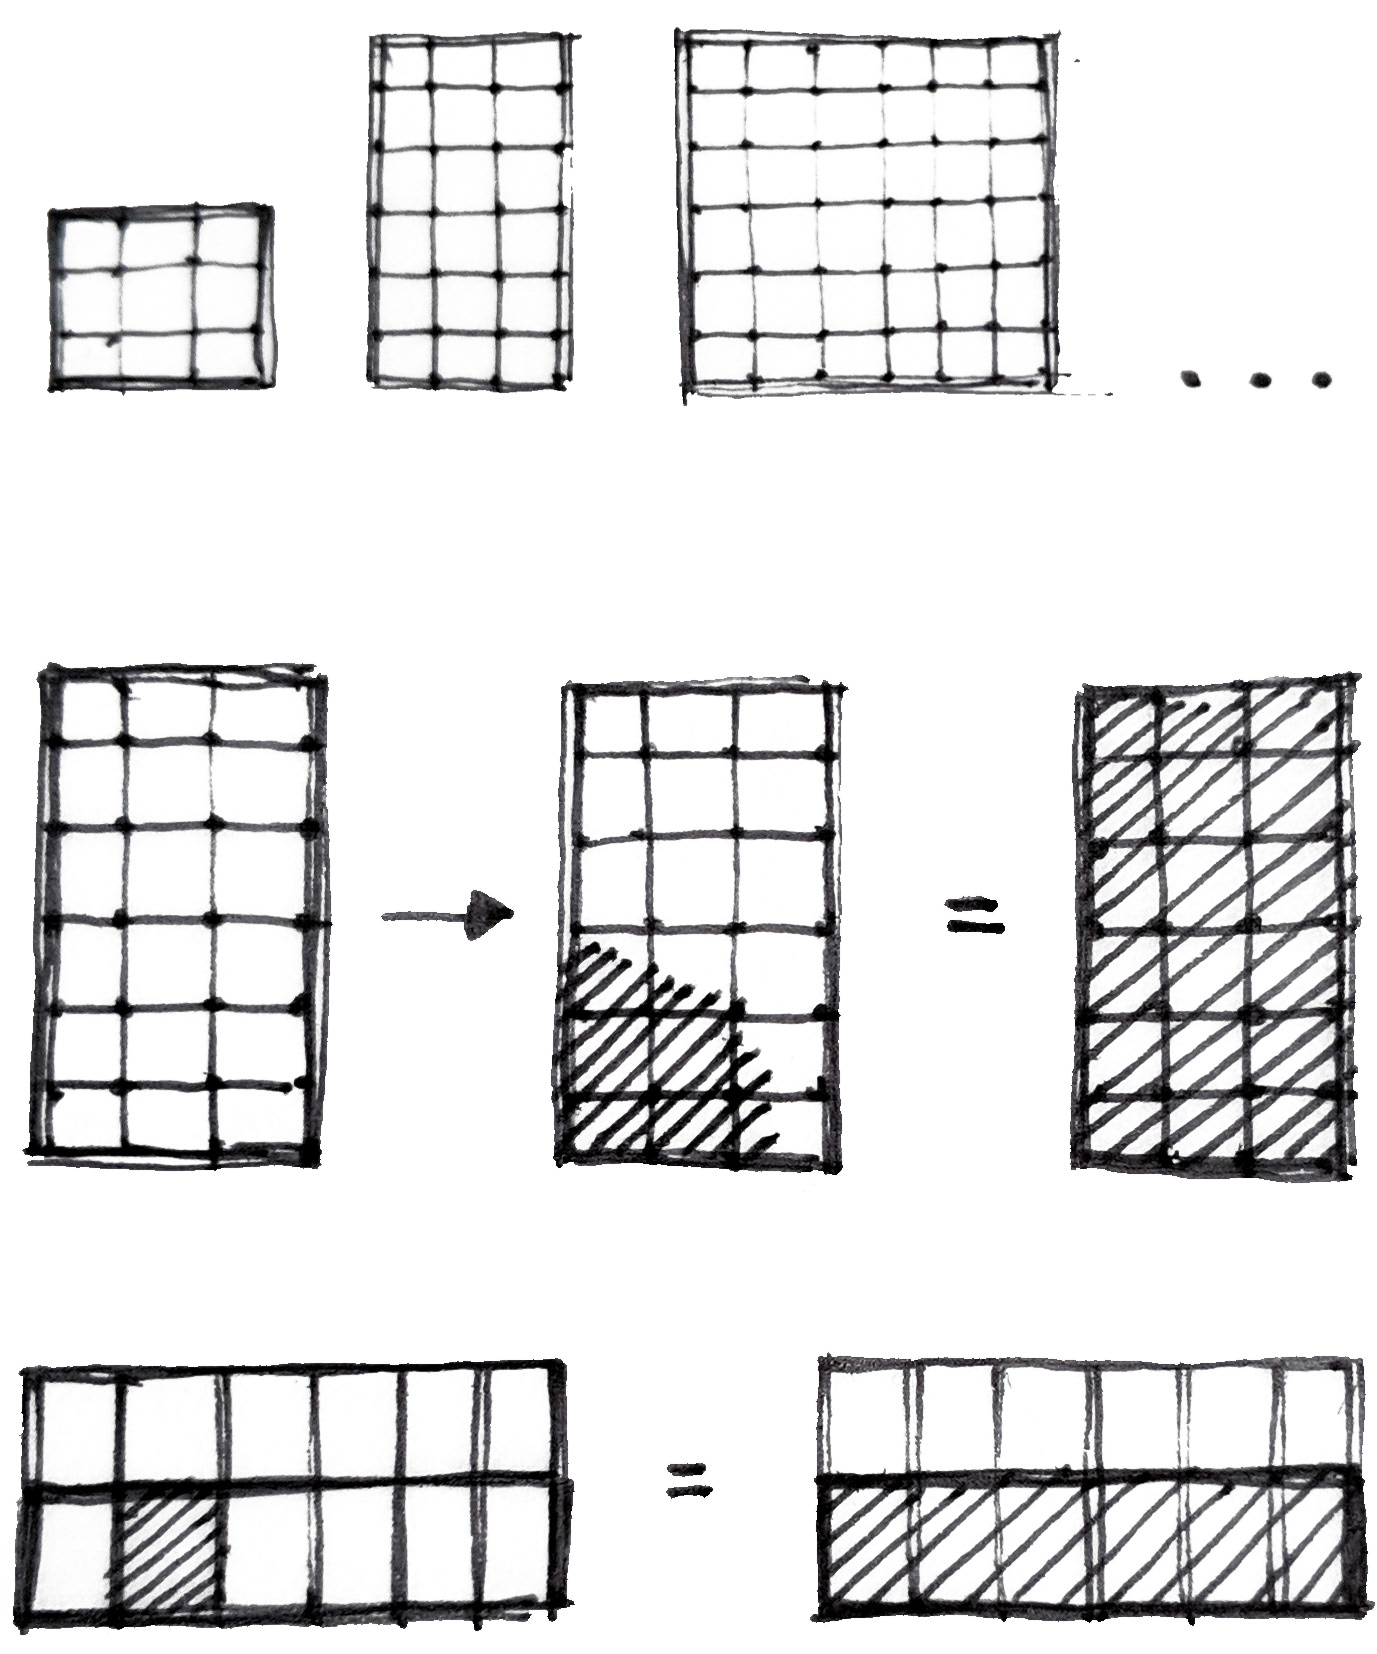
Therefore, at the beginning, fundamental basics regarding solar energy generation as well as already existing approaches to this topic were researched and tested. For a better understanding of the following pages, we would like to briefly discuss the (partial) shading problem of PV modules:
Each PV module consists of many individual solar cells, which are usually connected in series (occasionally also in parallel). Due to the series connection, the maximum efficiency of a module is mainly defined by the efficiency of the weakest cell. In other words: if a part of the module is shaded, the whole module fails. In addition, several modules are also connected in series with other modules, which in turn means that the entire series-connected module row can only be as efficient as the weakest link in its chain. In order to design a high-yield solar system, it is up to the engineer to arrange and align the sub-modules of a system according to their irradiance (limited by orientation and especially shading).
In view of the climate change and against the university background of the interdisciplinary team (energy efficient and sustainable building / architecture) the idea was born to activate unused roof areas as green energy suppliers by means of PV modules.
Based on this idea we create a tool, which is not only of interest for the knowledgeable expert, but rather enables the concerned and interested real estate owner to efficiently deal with the topic.
At the beginning the question arises "What is the potential of a roof? In order to determine this realistically, an analysis is required that takes into account many complex aspects. Starting with the location and orientation of the building, through the shading of the sometimes complex roof surface caused by surrounding objects, to the individual modules that can be used. The latter alone differ in various types of superstructure, vary in shape and size, and thus result in a wide range of costs and services.
Therefore, at the beginning, fundamental basics regarding solar energy generation as well as already existing approaches to this topic were researched and tested. For a better understanding of the following pages, we would like to briefly discuss the (partial) shading problem of PV modules:
Each PV module consists of many individual solar cells, which are usually connected in series (occasionally also in parallel). Due to the series connection, the maximum efficiency of a module is mainly defined by the efficiency of the weakest cell. In other words: if a part of the module is shaded, the whole module fails. In addition, several modules are also connected in series with other modules, which in turn means that the entire series-connected module row can only be as efficient as the weakest link in its chain. In order to design a high-yield solar system, it is up to the engineer to arrange and align the sub-modules of a system according to their irradiance (limited by orientation and especially shading).
Problem statement user needs
Types and modes of operation panels
After a conversation with an engineer specialized in solar energy, we examined a professional software, which is used nowadays for the simulation of a potential roof surface. The results showed that the individual customization within the software, compared to (other) CAD programs, is quite limited and also the results finally output by the program are expandable for today's technical possibilities. Only simple roof shapes can be designed for maximum area with only one predefined module. Only after this step a solar irradiation over a whole year is simulated to determine the shading degrees of the strictly geometrically laid modules. The engineer then manually sorts out the modules that lie below a specially defined shading degree value and must then manually optimize the module arrangement that remains.
The goal of our project was therefore to create an innovative tool that can handle complex geometries, allow varying irradiation thresholds, and calculate a wide range of simulation variants. Depending on the user-specific parameters, these results should enable an optimal choice of solution and be output in a graphically easy-to-understand manner. Thus, not only the professional approach within the industry shall have been improved, but also the non-expert shall be able to use these technologies.
The goal of our project was therefore to create an innovative tool that can handle complex geometries, allow varying irradiation thresholds, and calculate a wide range of simulation variants. Depending on the user-specific parameters, these results should enable an optimal choice of solution and be output in a graphically easy-to-understand manner. Thus, not only the professional approach within the industry shall have been improved, but also the non-expert shall be able to use these technologies.
Basic idea for the arrangement of the modules
CONCEPT
The basic idea behind the program's mode of operation is to calculate as many variants as possible by means of a small number of manual inputs in order to generate an optimal solution tailored to each individual using personalized filters. Thus, only the always varying data of the location of the building concerned, the roof to be analyzed including an environment model and the own annual power consumption are required as input. Other relevant aspects, such as physical reference values or the actually usable area of the roof depending on the irradiation limit value, are already integrated in the algorithm. Even a list of all PV modules (as of 01/16/2019) is already included. This is to enable a simple and efficient handling of the tool.
After entering the required data, all combination possibilities are calculated and output in each case as 2D and 3D graphics along with clear tabular information. In order not to lose the overview of the large selection, all possibilities are graphically displayed and structured according to the integrated aspects. Thus, all important information can be clearly illustrated and even compared even without prior engineering knowledge.
Concept - Tool
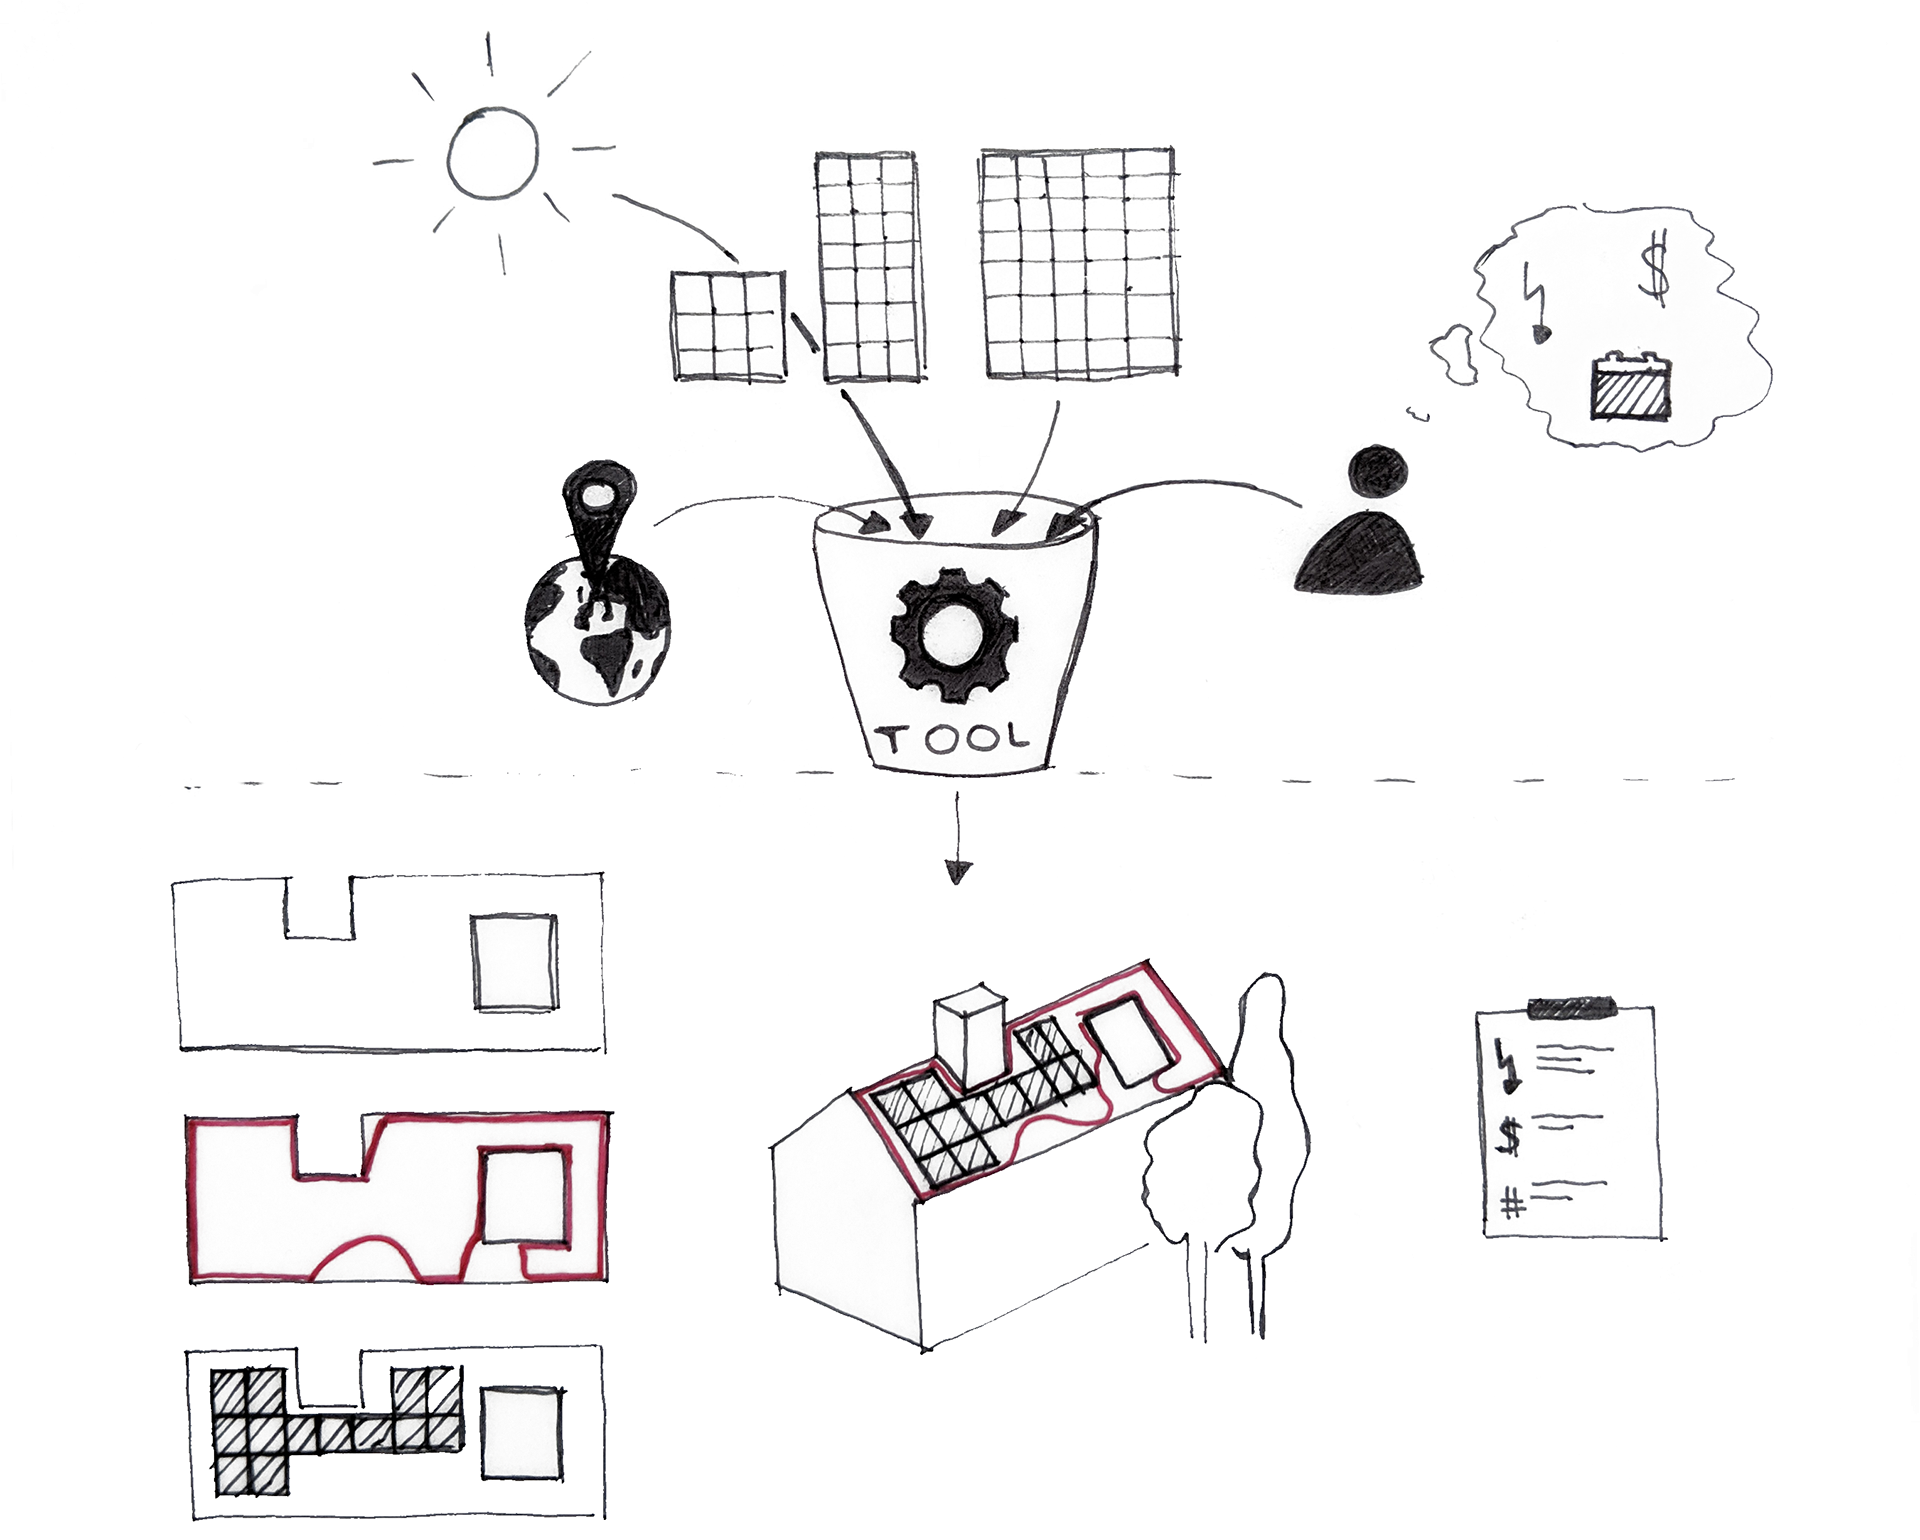
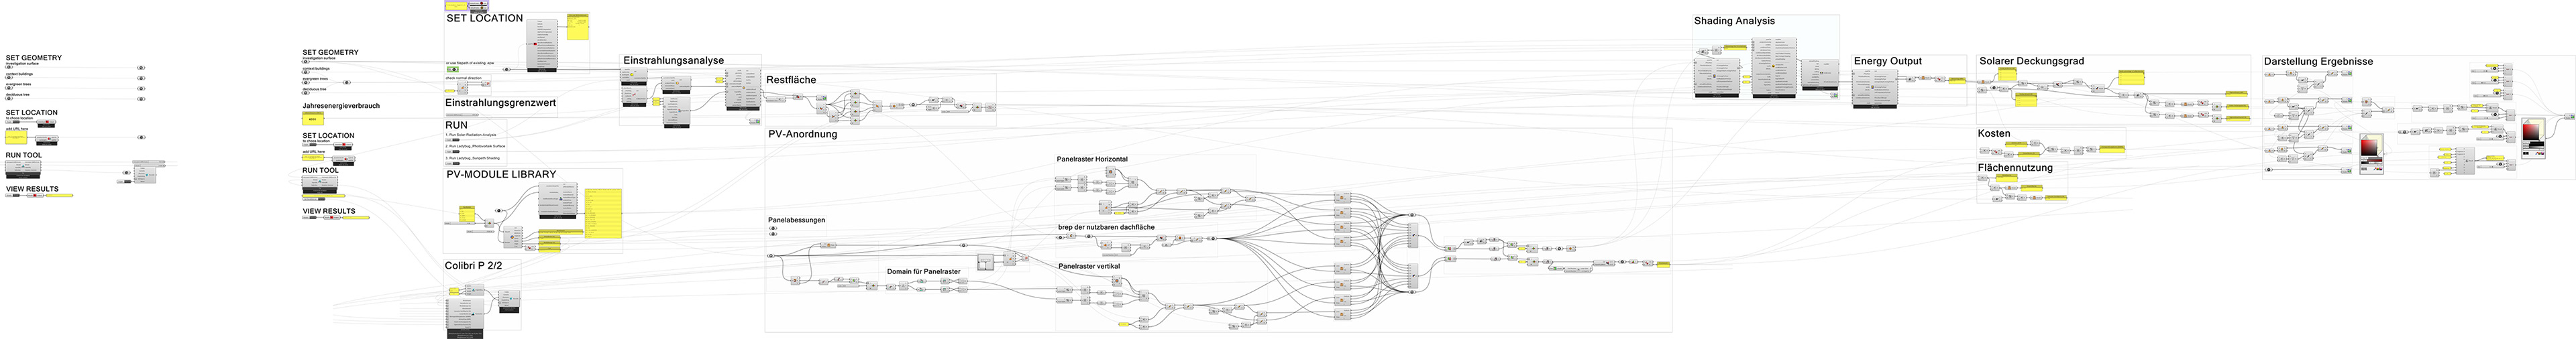
The figure below shows a general overview of the OptiSol algorithm and serves the understanding of the following explained procedure of its programming. At this point it should be mentioned that some variables have been simplified for the purpose of the course. The individual steps are described in more detail and with graphics on the following pages.
On the left hand side, i.e. at the beginning of the algorithm, there are all still to be inserted and individually dependent parameters (location, 3D model, own annual power consumption), as well as the start button for the following variant simulation.
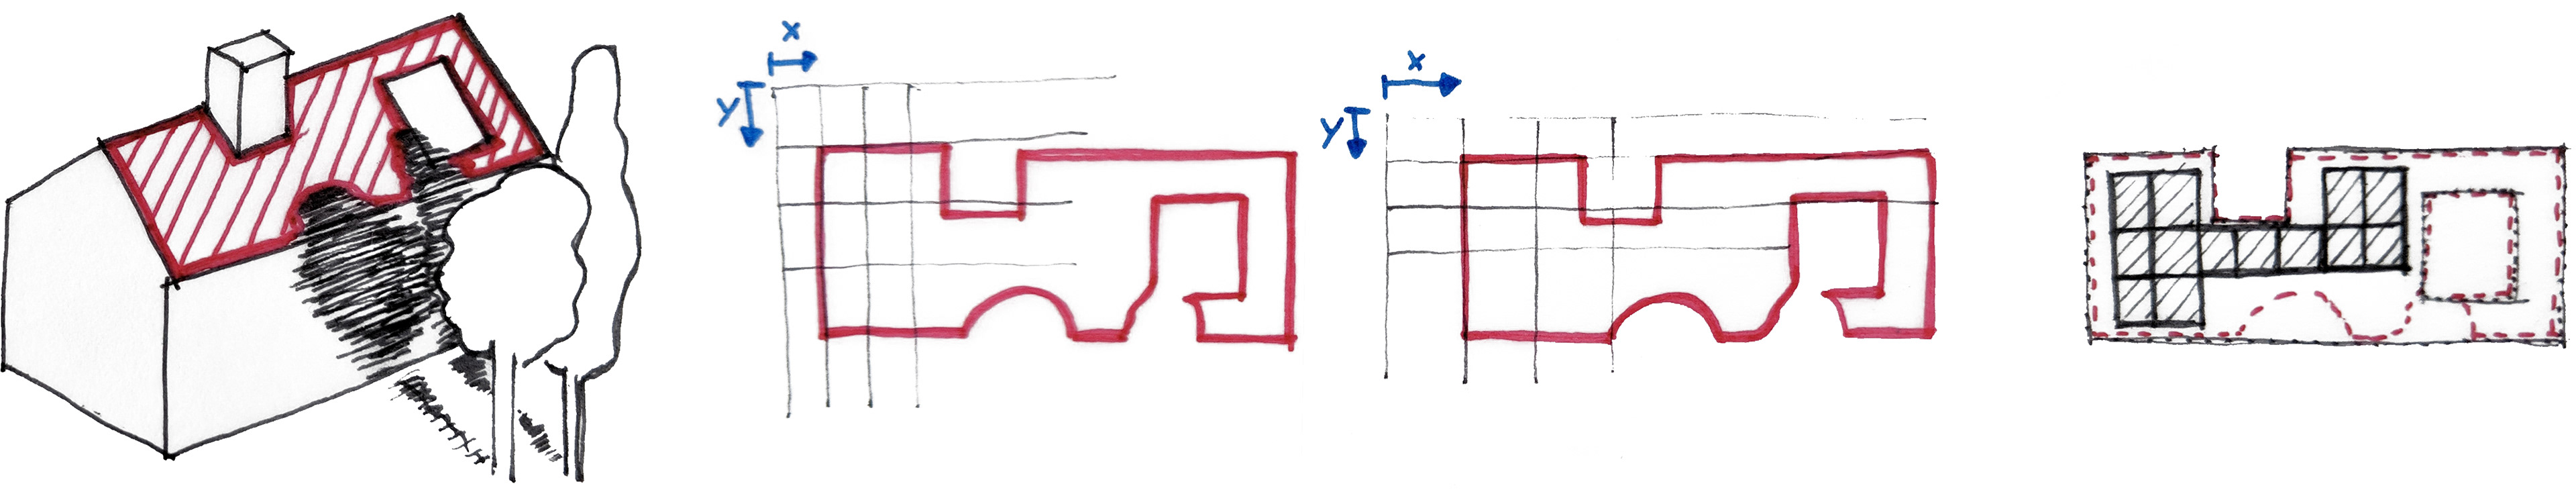
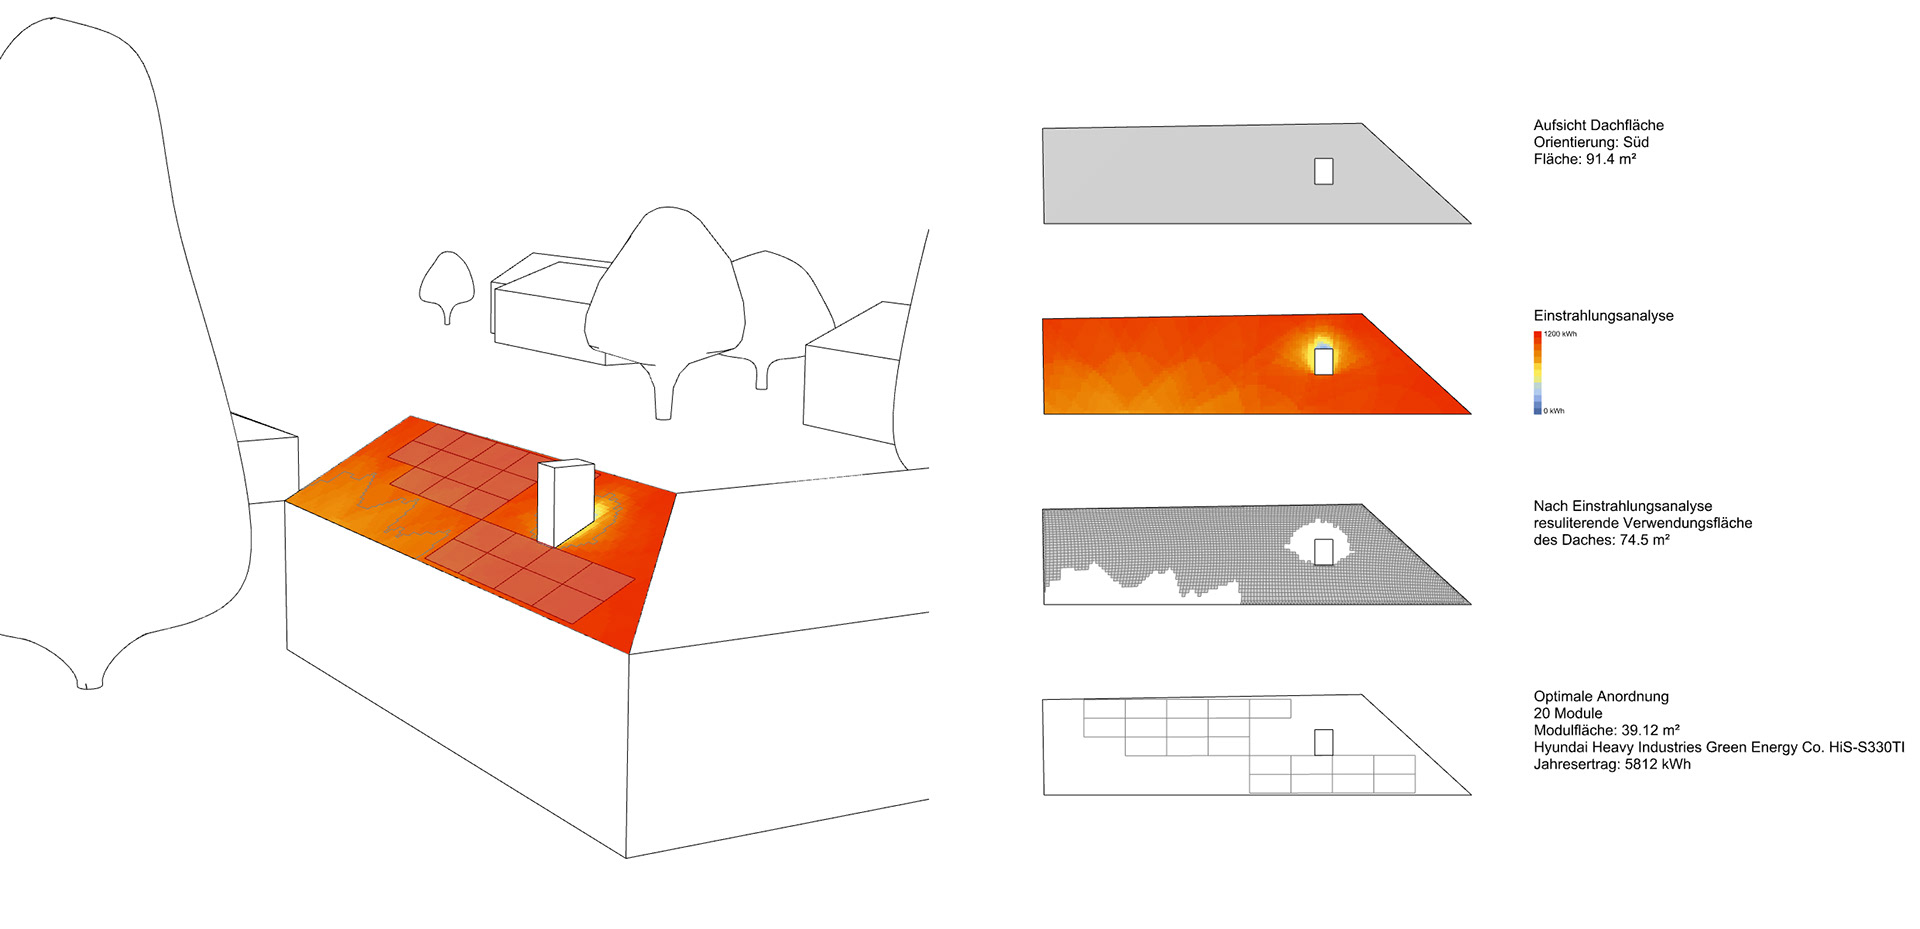
As a first step, the roof area to be analyzed is subjected to an irradiation analysis. For this purpose, the geometry of the surrounding buildings is used in addition to the location. By means of a varying irradiation limit value, the resulting usable area can be determined.
The usable area resulting from the analysis (also referred to as residual area in the figure) describes the area, which varies depending on the irradiation limit value, on which PV modules can be arranged without losing their performance due to insufficient irradiation intensities caused by strong shading. Based on the dimensions of the module to be tested in each case, various grids are moved above this in order to determine with which orientation of this specific module the maximum occupancy within the relevant area can be realized. Modules are to be arranged in a grid and not freely due to construction and assembly. All relevant PV modules are also already integrated in the program by means of an Excel table. Based on practical experience, no combinations of different module types have been calculated so far.
The usable area resulting from the analysis (also referred to as residual area in the figure) describes the area, which varies depending on the irradiation limit value, on which PV modules can be arranged without losing their performance due to insufficient irradiation intensities caused by strong shading. Based on the dimensions of the module to be tested in each case, various grids are moved above this in order to determine with which orientation of this specific module the maximum occupancy within the relevant area can be realized. Modules are to be arranged in a grid and not freely due to construction and assembly. All relevant PV modules are also already integrated in the program by means of an Excel table. Based on practical experience, no combinations of different module types have been calculated so far.
For the best variant of each module with respect to varying limit values, the hourly power of the modules is calculated with the help of the plugin Ladybug. For this, the already mentioned module list, with all important module parameters, is also needed.
On the right side of the screen further calculations follow for a later selection of the best variant. These include values such as specific electricity production costs, total energy yield, as well as the solar coverage (depending on the own consumption). Finally, the algorithm is summarized and unified in all visualizations relevant for the graphical evaluation.
On the right side of the screen further calculations follow for a later selection of the best variant. These include values such as specific electricity production costs, total energy yield, as well as the solar coverage (depending on the own consumption). Finally, the algorithm is summarized and unified in all visualizations relevant for the graphical evaluation.
In the following, the individual steps of the tool are described in more detail:
User input - Irradiance analysis - PV module list - Module arrangement - PV yield - Calculations - Graphics - Variant simulation - DesignExplorer
User input - Irradiance analysis - PV module list - Module arrangement - PV yield - Calculations - Graphics - Variant simulation - DesignExplorer
Tool input and evaluation
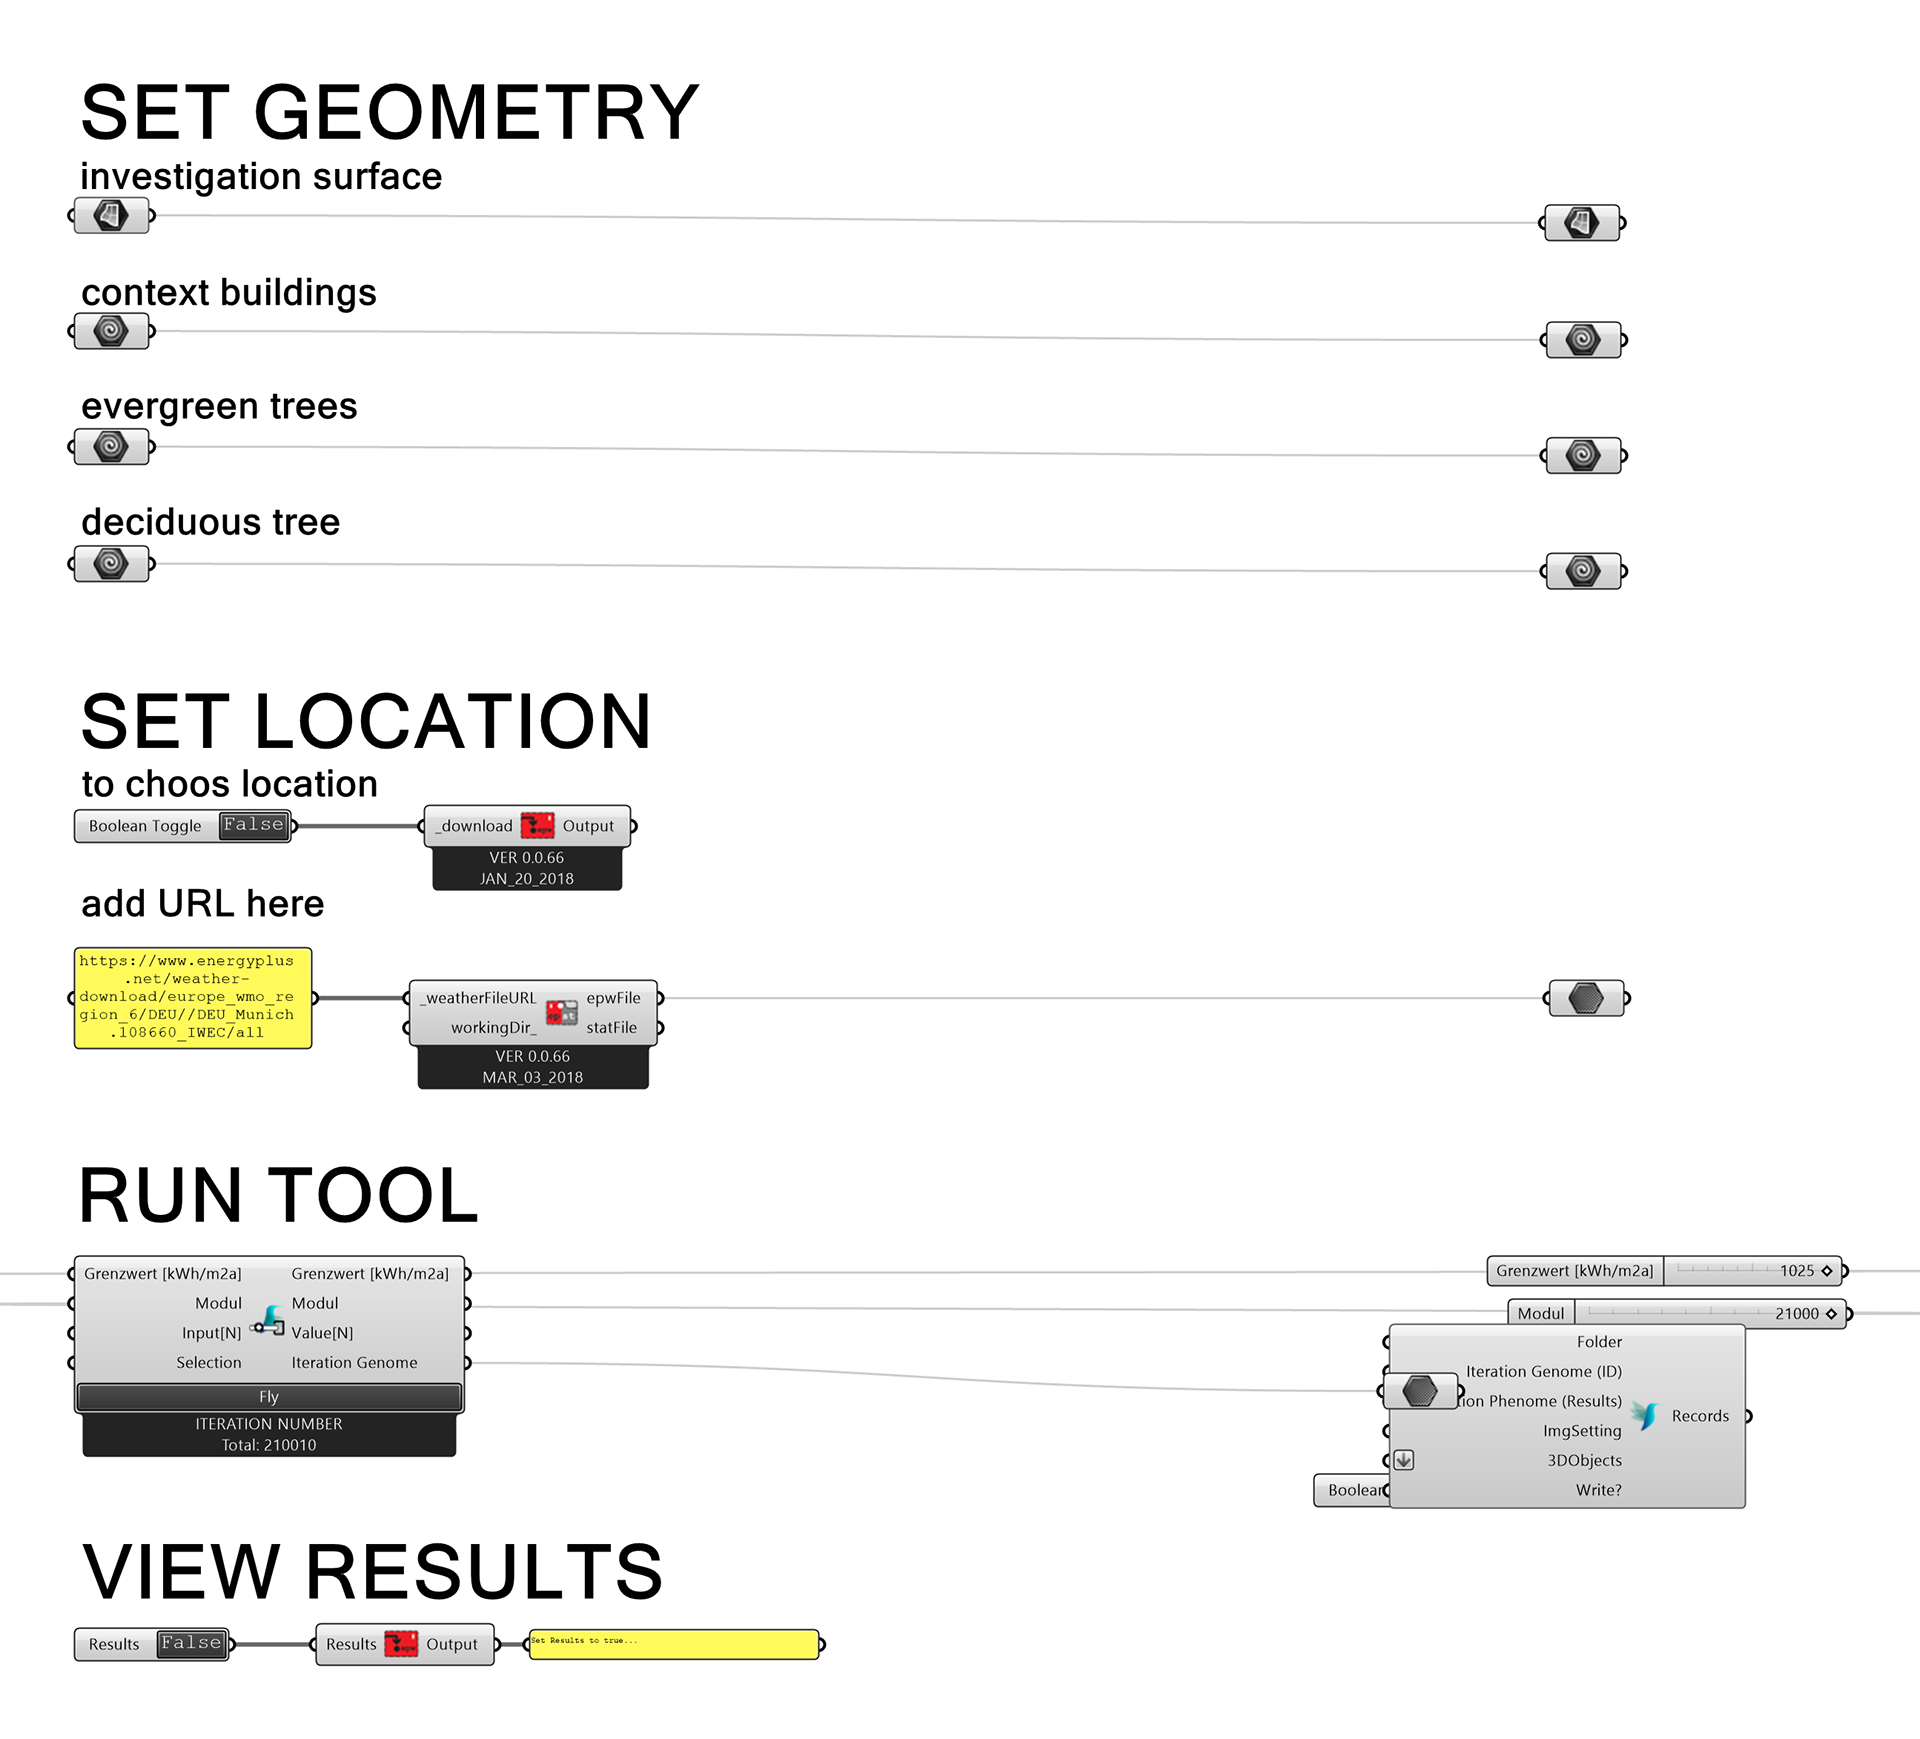
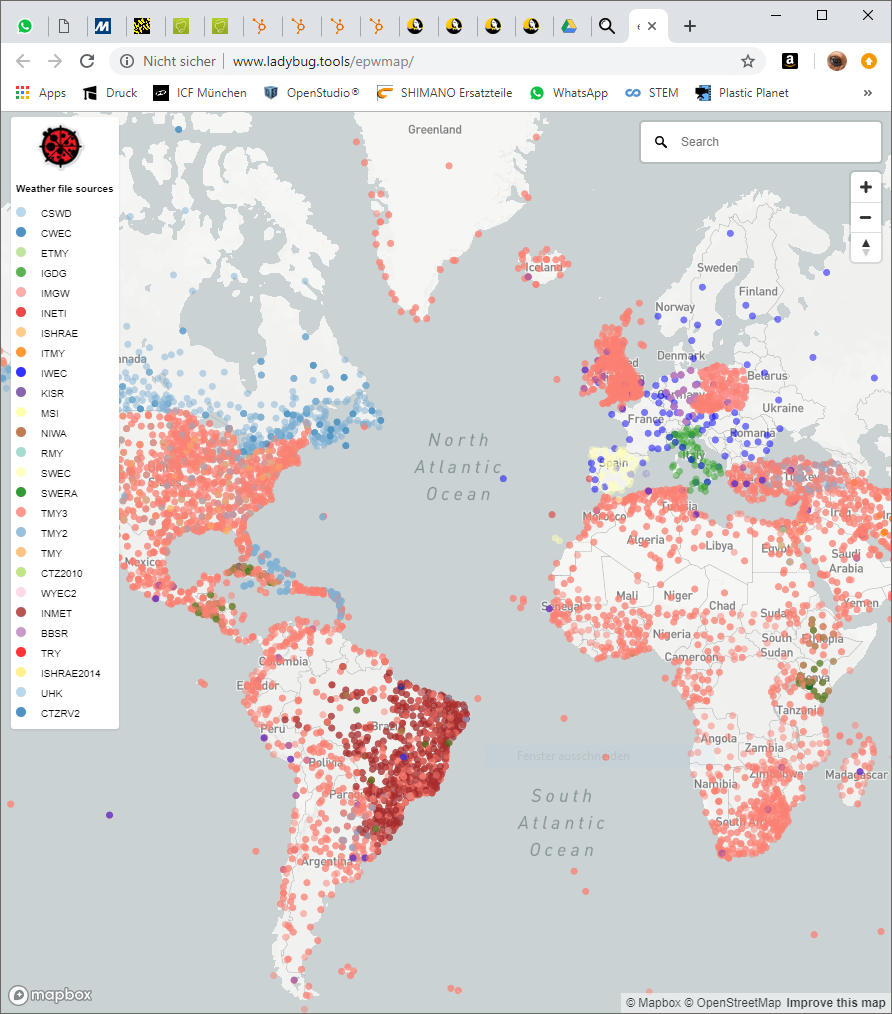
The site selection is mandatory to ensure a realistic simulation, the map is opened automatically for this purpose, the URL of the site must be copied and pasted. After that, the required three-dimensional geometries from the 3D program Rhinoceros are linked with the respective inputs in Grasshopper.
The site selection is mandatory to ensure a realistic simulation, the map is opened automatically for this purpose, the URL of the site must be copied and pasted. After that, the required three-dimensional geometries from the 3D program Rhinoceros are linked with the respective inputs in Grasshopper.
Eingabeparameter für die Simulation
Karte zur Standortbestimmung
The simulation of the different variants is created with the help of the PlugIn Colibri. The module list and the different irradiation limit values serve as inputs to be varied. The graphical result of a simulated option consists of a perspective image and a two-dimensional overview of the individual steps and is output in image files.
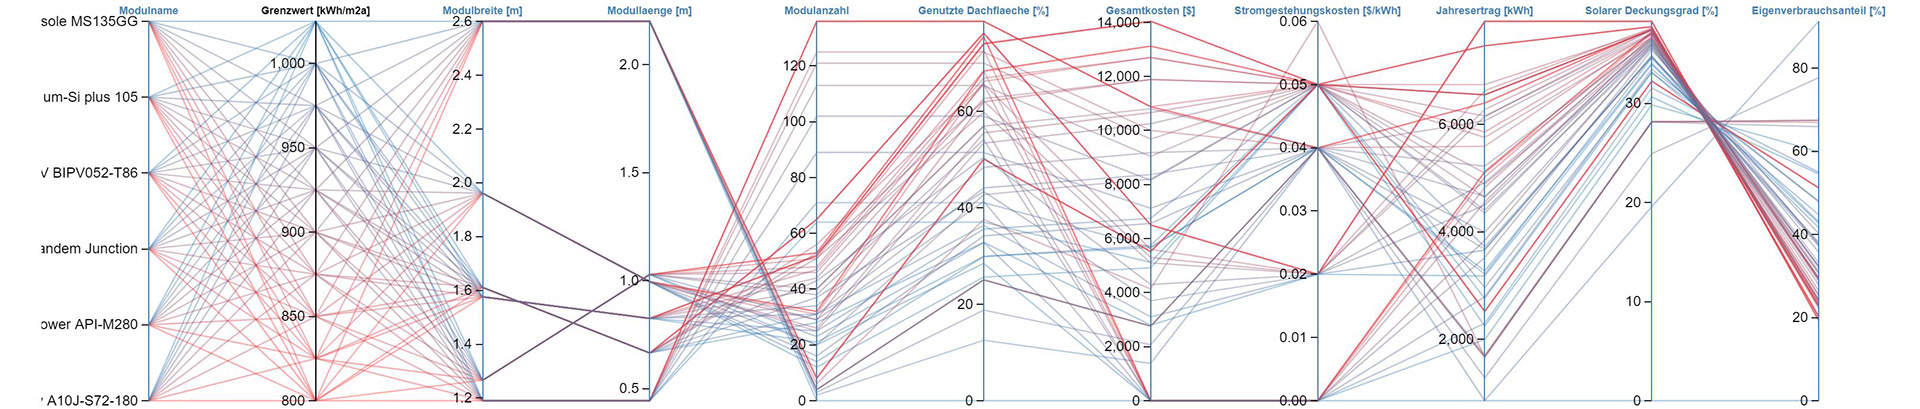
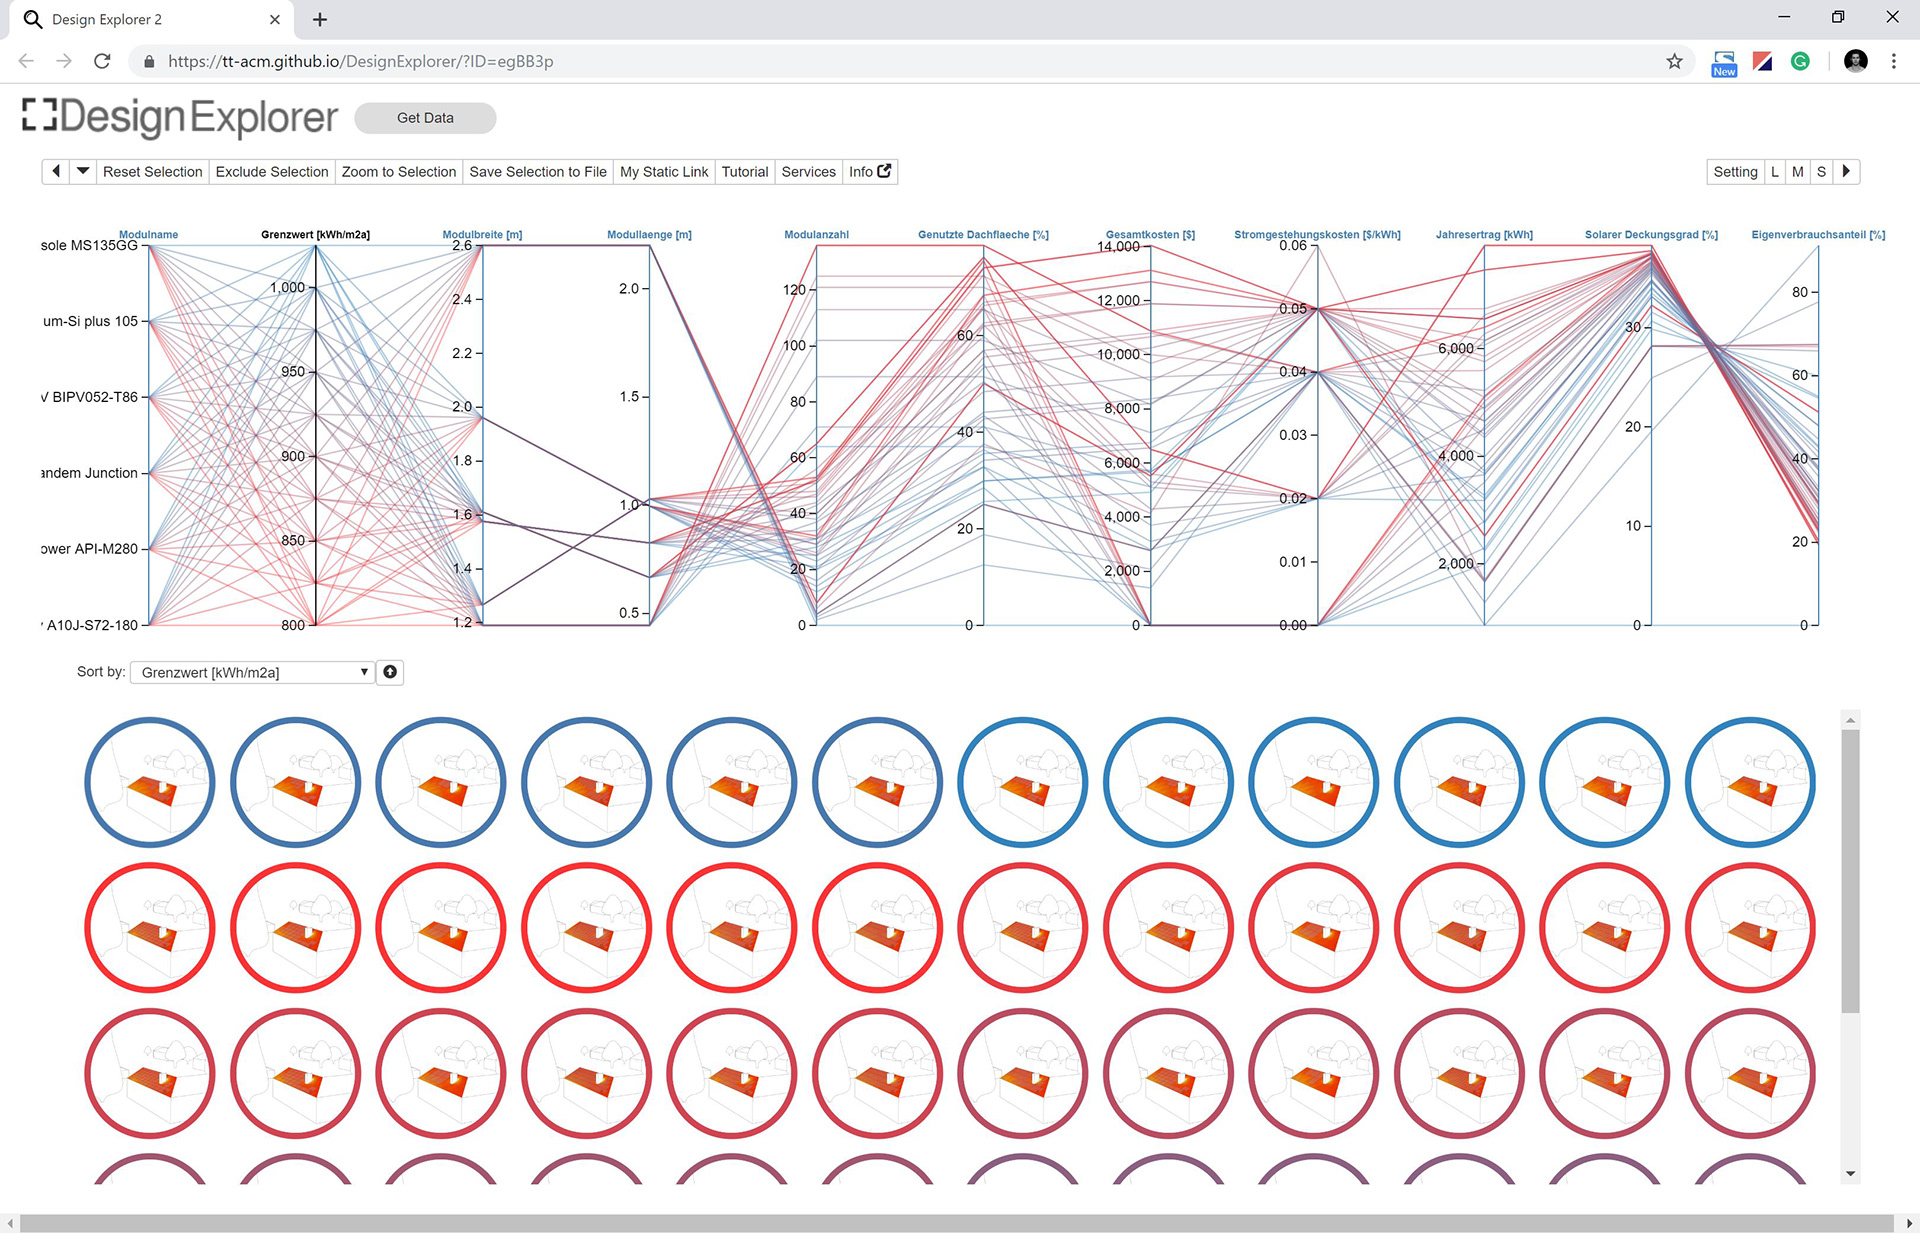
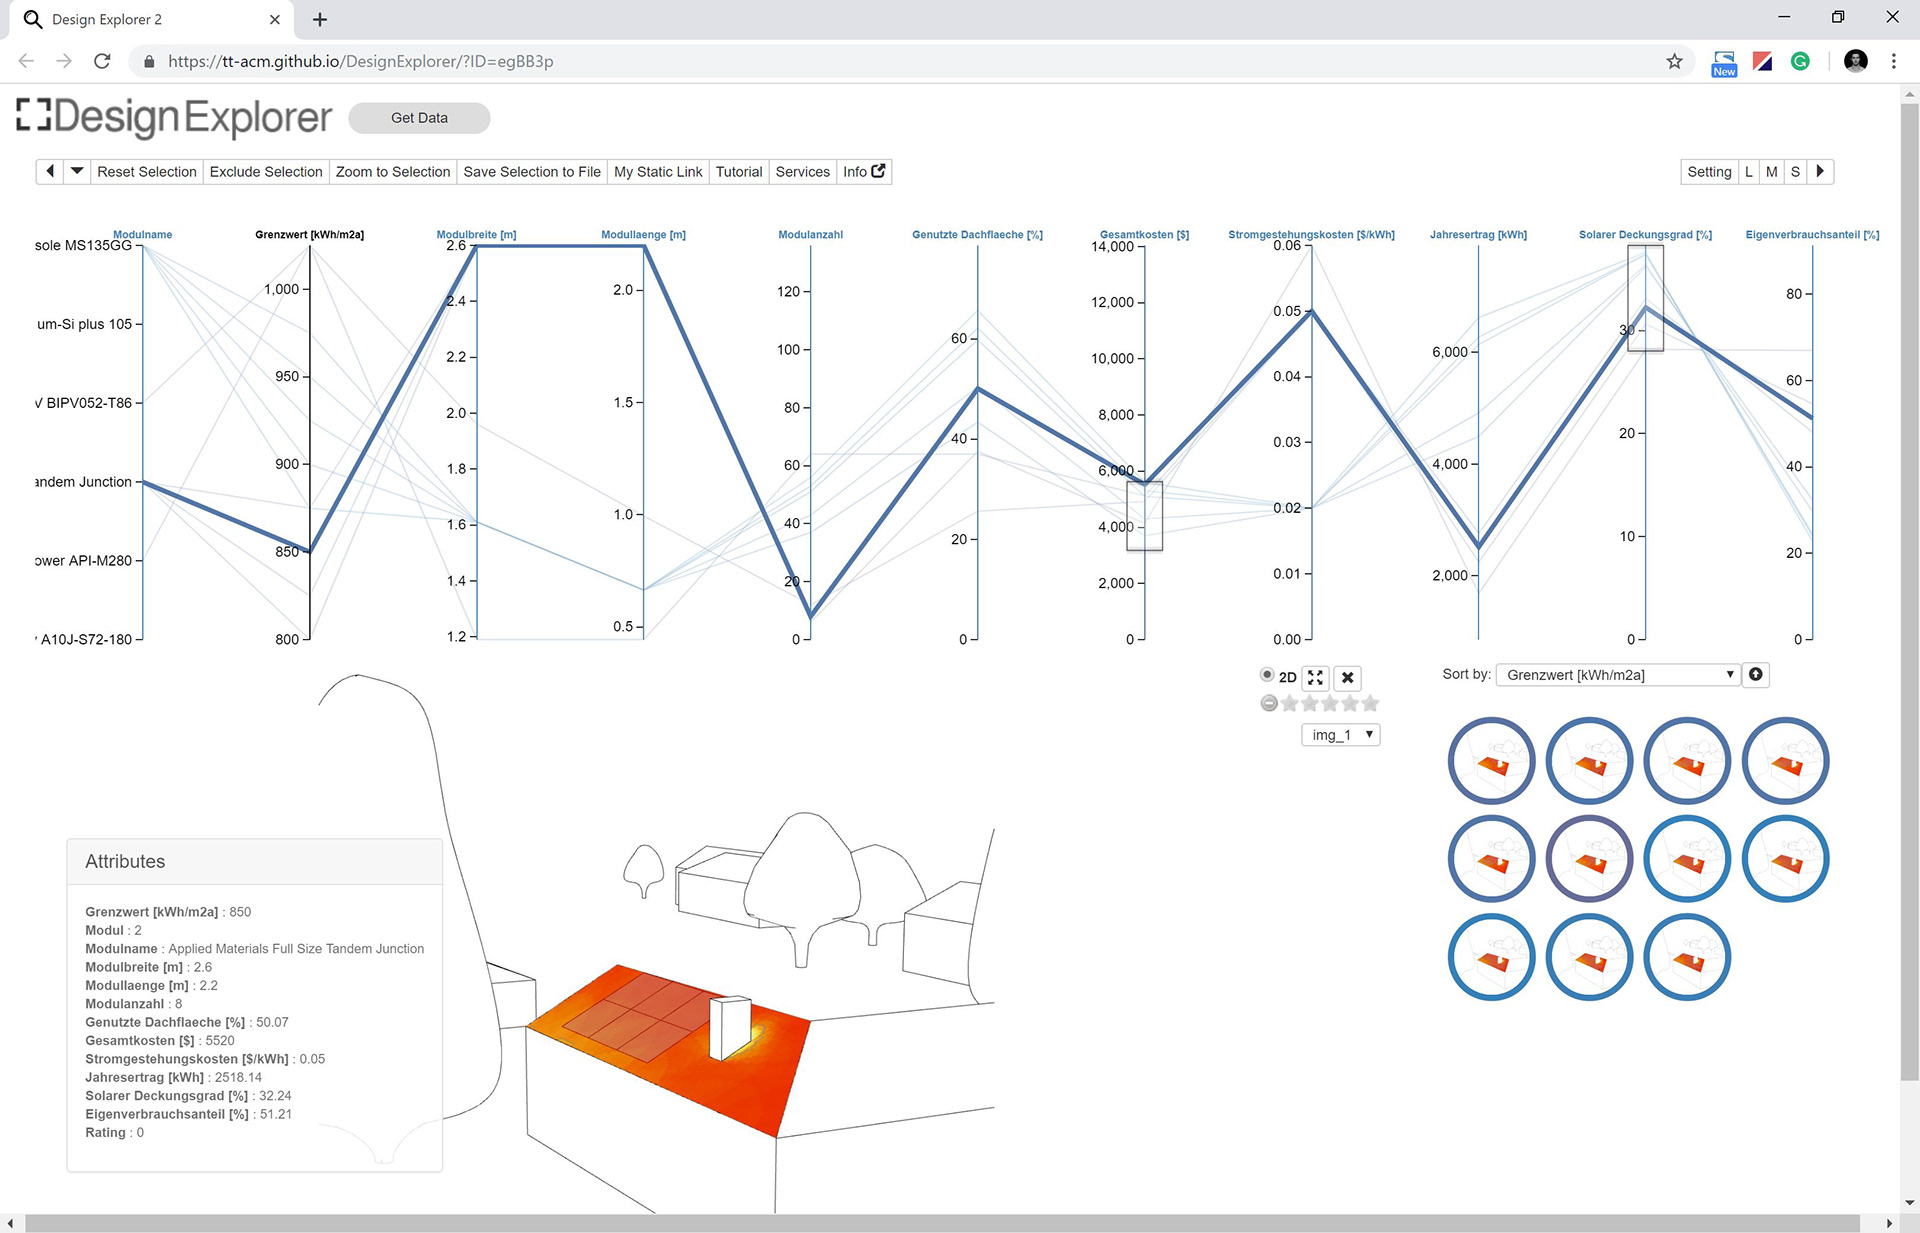
With the help of the online tool DesignExplorer and the CSV file created in Colibri with all the information, all possible variants can be clearly displayed. The individual variants are also linked with 2 detailed image files each and can be sorted according to various parameters and also evaluated individually for later comparisons.
Thanks to interactive controls (selection of a parameter section) within the graphical representation of the variations, the individually adapted optimal solution can be found in the simplest way. As soon as a variation is selected, a data sheet with all information as well as the previously mentioned graphical representations are displayed.
Grafische Ausgabe einer Simulation
DesignExplorer - Übersicht
Design Explorer - Auswahl
Conclusion
The results generated by OptiSol enable the user to independently select the best variant according to his own criteria. By displaying all simulation variants, not one "right" solution is presented, but a clear possibility to filter by parameters is created.
The three-dimensional input of the model requires a certain expertise, but the simple handling with only very few input steps and especially the clear and intuitive evaluation allow anyone interested to use the tool. Therefore, the tool can also be used as an interface between specialist planner, architect and client, as the results can be shared, viewed and evaluated via any browser, even without Rhino/Grasshopper.
OptiSol 1.0 has great potential to be expanded and extended in the future. Due to very volatile prices, the costs calculated so far for the individual modules currently still correspond to the simplest standards. Further expenses concerning the assembly or the electricity supply or purchase price would be just as conceivable for an economic implementation as the use of different electricity storage systems.
The programming environment Grasshopper/Rhino was chosen in the context of Performance Based Design. However, only a limited number of variants could be simulated in this framework, as the computing time is still far too high. Unfortunately, a more powerful computer could not provide a fast solution here, since only one processor is accessed as computing power due to the environment. Therefore, nutritional values are still used for the different irradiation limits and module arrangements. A smaller grid offset would be desirable, especially for large-format modules, and the current gradation of the irradiation limit of 25 kWh/m²a could be further refined.
In spite of all these optimization potentials, OptiSol already manages to hold its own against market-established programs. In professional use, not only are more efficient variants evaluated with less effort, but the results are also output in an easily understandable and sortable way. Optisol breaks new ground in its conception in the industry and enables interested parties undreamt-of possibilities.
In spite of all these optimization potentials, OptiSol already manages to hold its own against market-established programs. In professional use, not only are more efficient variants evaluated with less effort, but the results are also output in an easily understandable and sortable way. Optisol breaks new ground in its conception in the industry and enables interested parties undreamt-of possibilities.
Demonstration OptiSol